News coverage of climate and health tends to focus on heat waves. Heat waves are real, and they kill people. But the largest studies of temperature and death show that, around the world and especially in Canada, cold is the bigger killer.
Cold kills far more people than heat
In 2015, The Lancet published one of the largest studies of its kind. A team led by Antonio Gasparrini analysed more than 74 million deaths in 384 locations across 13 countries, including Canada, over periods between 1985 and 2012. They found that 7.71% of those deaths could be attributed to non-optimal temperatures. Cold accounted for 7.29% and heat for 0.42%, about 17 cold-related deaths for every heat-related one. Most of the cold toll came not from extreme cold snaps but from ordinary, moderately cold days.
A follow-up study in The Lancet Planetary Health (Zhao and colleagues, 2021) used data from 750 locations in 43 countries to estimate the global picture for 2000 to 2019. About 5.1 million deaths a year were associated with non-optimal temperatures, or 9.43% of all deaths. Cold-related deaths made up 8.52% of all deaths and heat-related deaths 0.91%, a ratio of more than nine to one.
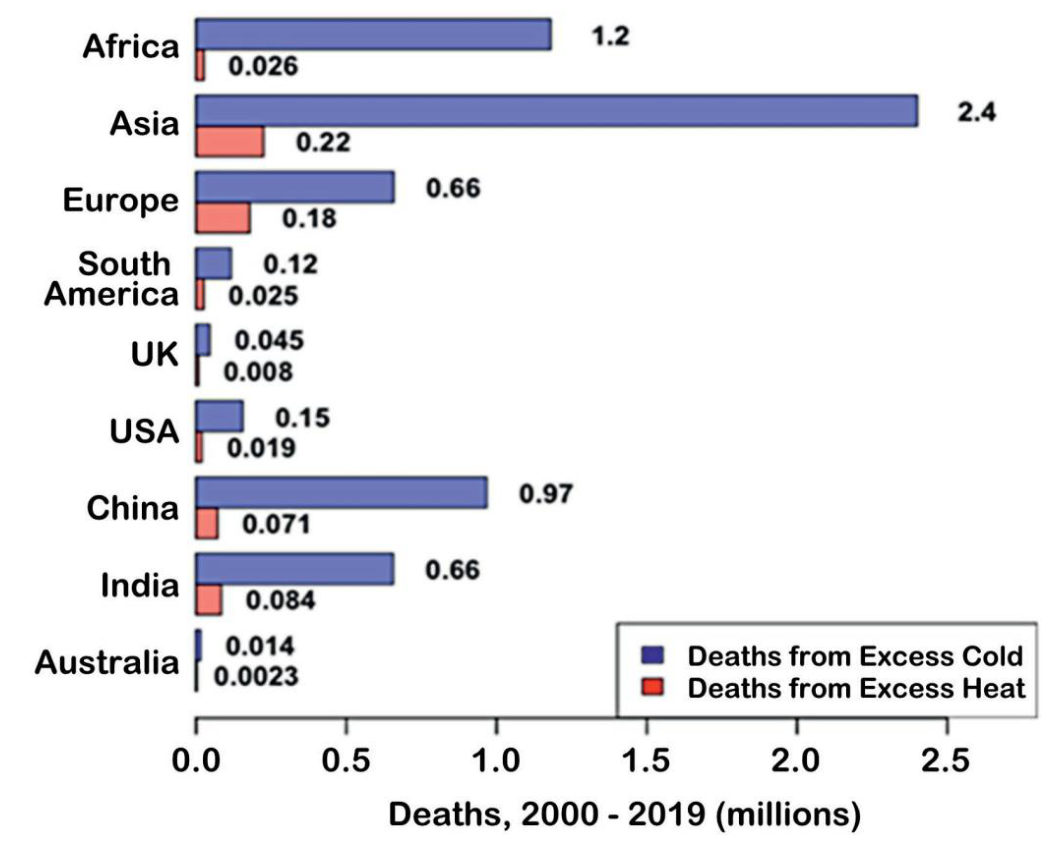
Estimated deaths per year linked to cold (blue) and heat (red), averaged over 2000–2019, based on Zhao et al. (2021).
Canada is a cold country
Canada fits the global pattern. In Gasparrini’s data for 21 Canadian cities (1986–2009), 4.46% of deaths were linked to cold and 0.54% to heat, about eight to one. Quebec’s statistics agency reports that from 2000 to 2019, January had about 14% more deaths than average and August about 9% fewer. The winter excess was largest for respiratory diseases, much of it influenza, and circulatory diseases.
Staying warm is also expensive. Space heating accounts for 61% of all the energy Canadian homes use, according to Natural Resources Canada. A peer-reviewed study by Mylène Riva and colleagues, using 2017 data, estimated that 6% to 19% of Canadian households live in energy poverty, depending on the measure, with the odds almost twice as high in the Atlantic provinces and rural areas. These families feel every rise in heating costs.
A milder climate also has upsides for a northern country. Environment and Climate Change Canada scientists (Vincent and colleagues, 2018) found that since 1948 Canada’s growing season has lengthened and growing degree-days, a measure of the warmth crops need, have increased.
Plants also respond to carbon dioxide. A satellite study in Nature Climate Change (Zhu and colleagues, 2016) found that from 1982 to 2009, between 25% and 50% of the world’s vegetated land became greener, while less than 4% became browner. Their models attributed about 70% of that greening to the fertilizing effect of more CO₂ in the air.
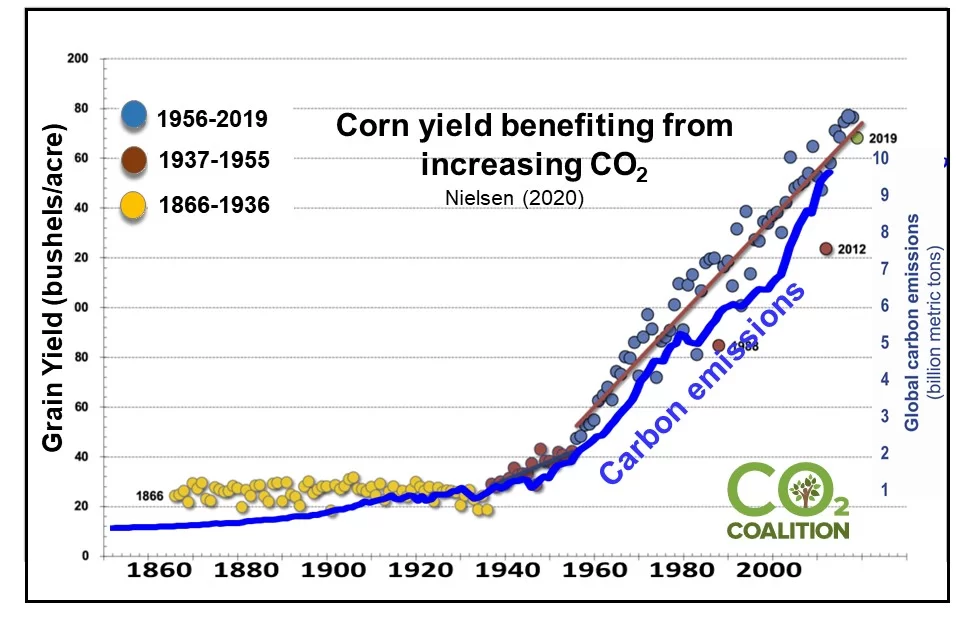
U.S. corn yields, 1866–2019, with global carbon emissions (chart by the CO2 Coalition, based on Nielsen, Purdue University).
U.S. corn yields averaged about 26 bushels per acre from 1866 to 1936, then climbed steadily, by about 1.9 bushels per acre per year since the mid-1950s. Purdue agronomist Bob Nielsen credits better hybrids, nitrogen fertilizer, pesticides, machinery and improved management for most of that gain; the chart’s makers argue that rising CO₂ helped too. Either way, harvests have kept rising as the world has warmed.
Heat is real, and adaptation works
None of this means heat is harmless. During British Columbia’s heat dome, from June 25 to July 1, 2021, the BC Coroners Service found that 619 people died from the heat. Most were older adults who lived alone with chronic health problems, and the heat built up inside their homes. Only 46 of those 619 people had air conditioning.
Globally, Zhao and colleagues found that from the early 2000s to the late 2010s, the share of deaths linked to heat rose by 0.21 percentage points while the share linked to cold fell by 0.51 points, a net decline. Looking ahead, a 2017 projection by Gasparrini and colleagues found that under a high-emission scenario, and assuming no adaptation, cooler regions would see little or no net change in temperature-related deaths, while hot regions such as southeast Asia could see net increases.
That assumption of no adaptation matters. In the United States, economist Alan Barreca and colleagues found that the death toll from days averaging above 80°F (about 27°C) fell by 75% over the 20th century, almost entirely after 1960, and that the spread of home air conditioning explains essentially all of that decline. After the heat dome, BC’s coroners recommended a coordinated heat alert and response system and better support for people most at risk.
Affordable energy protects people from both
Whether the danger is a January cold snap or a summer heat dome, the people most at risk are the same: the old, the sick, the poor and those who live alone. What protects them is the same, too: a furnace that runs, an air conditioner they can afford to turn on, and a power grid that stays up.
A warmer world is not harmless, and heat deserves serious attention. But policies that make energy scarce or expensive also cost lives, in winter and in summer. Sensible climate policy keeps heating and cooling affordable and reliable, while investing in warning systems and help for the most vulnerable.
References
- Gasparrini A, et al. “Mortality risk attributable to high and low ambient temperature: a multicountry observational study.” The Lancet, 2015; 386(9991): 369–375. https://doi.org/10.1016/S0140-6736(14)62114-0
- Zhao Q, et al. “Global, regional, and national burden of mortality associated with non-optimal ambient temperatures from 2000 to 2019: a three-stage modelling study.” The Lancet Planetary Health, 2021; 5(7): e415–e425. https://doi.org/10.1016/S2542-5196(21)00081-4
- Institut de la statistique du Québec. “Seasonal variations of mortality in Québec: deaths highest in January and lowest in August.” October 25, 2023. https://statistique.quebec.ca/en/communique/seasonal-variations-of-mortality-in-quebec-deaths-highest-in-january-and-lowest-in-august
- Natural Resources Canada. “Energy Use in the Residential Sector” (Energy Efficiency Trends in Canada, 2020 data). https://oee.rncan-nrcan.gc.ca/publications/statistics/trends/2020/residential.cfm
- Riva M, et al. “Energy poverty in Canada: Prevalence, social and spatial distribution, and implications for research and policy.” Energy Research & Social Science, 2021; 81: 102237. https://doi.org/10.1016/j.erss.2021.102237
- Vincent LA, et al. “Changes in Canada’s Climate: Trends in Indices Based on Daily Temperature and Precipitation Data.” Atmosphere-Ocean, 2018; 56(5): 332–349. https://doi.org/10.1080/07055900.2018.1514579
- Zhu Z, et al. “Greening of the Earth and its drivers.” Nature Climate Change, 2016; 6: 791–795. https://doi.org/10.1038/nclimate3004
- Nielsen RL. “Historical Corn Grain Yields in the U.S.” Purdue University, updated February 2023. https://agry.purdue.edu/Ext/corn/news/timeless/YieldTrends.html
- BC Coroners Service. “Extreme Heat and Human Mortality: A Review of Heat-Related Deaths in B.C. in Summer 2021.” June 2022. https://www2.gov.bc.ca/assets/gov/birth-adoption-death-marriage-and-divorce/deaths/coroners-service/death-review-panel/extreme_heat_death_review_panel_report.pdf
- Gasparrini A, et al. “Projections of temperature-related excess mortality under climate change scenarios.” The Lancet Planetary Health, 2017; 1(9): e360–e367. https://doi.org/10.1016/S2542-5196(17)30156-0
- Barreca A, et al. “Adapting to Climate Change: The Remarkable Decline in the US Temperature-Mortality Relationship over the Twentieth Century.” Journal of Political Economy, 2016; 124(1): 105–159. https://doi.org/10.1086/684582